


上篇装完 MindCluster,NPU Exporter 已经在每个计算节点跑着,指标就在 8082 上。这篇把它接进 Prometheus,再在 Grafana 里做成能按节点、按卡号看的面板。
配置来自实际部署记录,指标名对照了昇腾官方文档。
一、链路
| 环节 | 干什么 | 命名空间 |
|---|---|---|
| NPU Exporter | 读驱动拿利用率、温度、功耗、内存,暴露 :8082/metrics | npu-exporter |
| Service | 把各节点的 exporter Pod 收成一个入口 | npu-exporter |
| ServiceMonitor | 声明抓谁、抓哪个端口、多久抓一次 | monitoring |
| Prometheus | 抓取并存储(kube-prometheus-stack) | monitoring |
| Grafana | 展示 | monitoring |
装了 Prometheus Operator 之后不写 scrape_configs,target 全靠 ServiceMonitor 这类 CRD 发现。label 一旦对不上,Prometheus 直接当作不存在,不报错、没数据。
前提:kube-prometheus-stack 已装,Prometheus 实例的 release label 是 kube-prometheus-stack(按实际改)。
参考:官方Prom接入文档
二、先确认 exporter 在出数
kubectl get pods -n npu-exporter -o wide
POD=$(kubectl get pod -n npu-exporter -l app=npu-exporter -o jsonpath='{.items[0].metadata.name}')
kubectl port-forward -n npu-exporter "pod/$POD" 18082:8082
另开一个终端:
curl -s http://127.0.0.1:18082/metrics | grep -E '^npu_chip_info_' | head -20
有输出再往下配。没有的话先查 Pod 和节点标签,问题不在 Prometheus 那头。
三、指标
| 指标 | 含义 | 单位 |
|---|---|---|
npu_chip_info_utilization | AI Core 利用率 | % |
npu_chip_info_temperature | 芯片温度 | ℃ |
npu_chip_info_power | 功耗 | W |
npu_chip_info_voltage | 电压 | V |
npu_chip_info_aicore_current_freq | AI Core 当前频率 | MHz |
npu_chip_info_used_memory / total_memory | DDR 已用 / 总量 | MB |
npu_chip_info_hbm_used_memory / hbm_total_memory | HBM 已用 / 总量 | MB |
npu_chip_info_health_status | 健康状态,1 健康 / 0 异常 | 0 / 1 |
npu_chip_info_error_code / _X | 错误码,无错误不上报 | - |
npu_chip_info_process_info_num | 占用芯片的进程数 | 个 |
npu_chip_info_bandwidth_rx / _tx | 网口收 / 发速率 | MB/s |
machine_npu_nums | 节点 NPU 数量 | 个 |
标签有 id(卡号)、model_name、vdie_id、pcie_bus_info,容器维度还有 pod_name、namespace、container_name。
不同芯片和版本支持的指标集不同,950DT 以 /metrics 实际输出为准。
四、Service
apiVersion: v1
kind: Service
metadata:
  namespace: npu-exporter
  name: npu-exporter
  labels:
    app: npu-exporter-svc
spec:
  type: ClusterIP
  ports:
  - port: 8082
    targetPort: 8082
    protocol: TCP
    name: http
  selector:
    app: npu-exporter
两个 app 别混:spec.selector.app: npu-exporter 匹配 Pod label,metadata.labels.app: npu-exporter-svc 给 ServiceMonitor 用。name: http 后面要引用。
kubectl get endpoints -n npu-exporter npu-exporter
为空说明 selector 没匹配上。
五、ServiceMonitor
apiVersion: monitoring.coreos.com/v1
kind: ServiceMonitor
metadata:
  labels:
    release: kube-prometheus-stack
  name: npu-exporter
  namespace: monitoring
spec:
  endpoints:
  - port: http
    path: /metrics
    interval: 30s
    scheme: http
    relabelings:
      - sourceLabels: [__meta_kubernetes_pod_node_name]
        targetLabel: node
  namespaceSelector:
    matchNames:
    - npu-exporter
  selector:
    matchLabels:
      app: npu-exporter-svc
release必须和 Prometheus 的 selector 对上,对不上就是静默忽略。查实际值:
kubectl get prometheus -n monitoring -o jsonpath='{.items[*].spec.serviceMonitorSelector}'
namespaceSelector和selector是「与」关系:一个限定命名空间,一个限定 Service label。endpoints.port引用 Service 里的端口名http。relabelings把宿主机节点名写成node标签,不加的话多节点曲线分不清是哪台机器。
应用后去 Prometheus UI 的 Status → Targets 找 serviceMonitor/monitoring/npu-exporter/0,UP 才算通。
六、NetworkPolicy
apiVersion: networking.k8s.io/v1
kind: NetworkPolicy
metadata:
  name: allow-prometheus-scrape
  namespace: npu-exporter
spec:
  podSelector:
    matchLabels:
      app: npu-exporter
  policyTypes:
    - Ingress
  ingress:
    - from:
        - namespaceSelector:
            matchLabels:
              kubernetes.io/metadata.name: monitoring
      ports:
        - protocol: TCP
          port: 8082
只放行 monitoring 访问 8082。没开网络策略的环境可跳过。
排障时先分清两种:Targets 里没有这一项,是 ServiceMonitor 没被选中;有但超时,才是网络或端口不对。
七、查询
# 每张卡的 AI Core 利用率
npu_chip_info_utilization

# 按节点平均
avg by (node) (npu_chip_info_utilization)

# HBM 使用率
100 * npu_chip_info_hbm_used_memory / npu_chip_info_hbm_total_memory

# 不健康的卡
npu_chip_info_health_status == 0

# 节点卡数
machine_npu_nums
挑一张卡,和 npu-smi info 的利用率、温度对一下;对不上先查标签,别急着调面板。
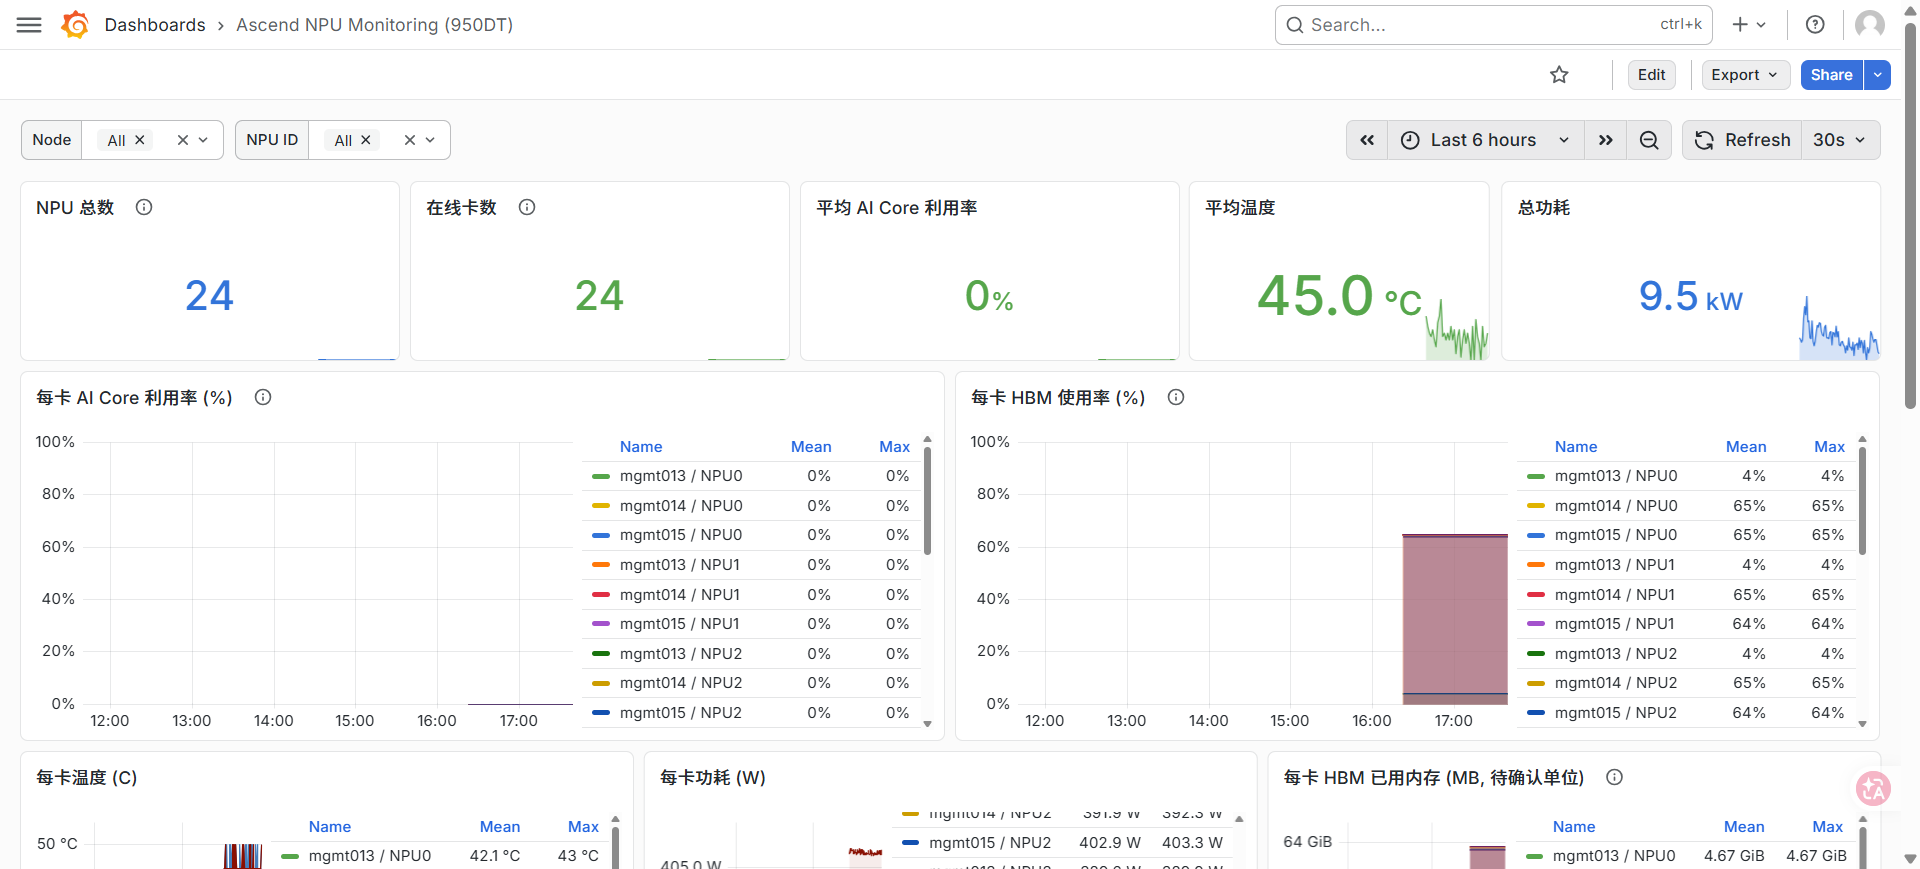
八、Grafana
| 面板 | 查询 | 看什么 |
|---|---|---|
| 集群概览 | machine_npu_nums、count(npu_chip_info_health_status == 0) | 卡数、异常卡 |
| 利用率 | npu_chip_info_utilization,按 node + id 分线 | 负载是否均衡 |
| HBM | 100 * npu_chip_info_hbm_used_memory / npu_chip_info_hbm_total_memory | 是否逼近上限 |
| 温度 / 功耗 | npu_chip_info_temperature、npu_chip_info_power | 过热、掉频 |
| 健康 | npu_chip_info_health_status、npu_chip_info_error_code | 故障定位 |
两个变量,按节点、卡号下钻:
node: label_values(npu_chip_info_utilization, node)
id:   label_values(npu_chip_info_utilization{node="$node"}, id)
查询里带 node=~"$node"、id=~"$id"。单位别用 auto:利用率 %、温度 Celsius、功耗 Watt、内存 MB。
告警看三个方向:温度超阈值、健康状态变 0、有任务但利用率长期贴 0。
图 1 | Grafana NPU 监控面板
九、踩坑
| 位置 | 问题 | 现象 |
|---|---|---|
| Service | selector 和 Pod label 对不上 | endpoints 为空 |
| Service | 把 Service label 当成 Pod label | ServiceMonitor 选不中 |
| ServiceMonitor | release 与 Prometheus selector 不匹配 | 静默忽略,一条数据没有 |
| ServiceMonitor | 漏了 namespaceSelector | 跨命名空间选不到 |
| ServiceMonitor | endpoints.port 与端口名不一致 | target 匹配失败 |
| relabelings | 没注入 node | 多节点曲线混在一起 |
| NetworkPolicy | 没放行 monitoring → 8082 | target 有但一直超时 |
| 指标 | 照抄别的版本的指标名 | 查询返回空 |
这些问题的共同点是都不报错,所以每层都要单独验一次,别攒到最后一起查。
十、最后
到这一步,这套 950DT 集群从驱动、调度到观测才算完整。Grafana 只是最上面一层,底下 target UP、标签齐、数值和 npu-smi 对得上,面板才有意义。


评论区